
Visualize Value Investing
Markets do not price the future from a clean slate. Short-term options flow, hedging pressure, volatility supply, and speculative demand all create a powerful anchor around today's price. Because longer-dated options are linked to the same surface, they can inherit this short-term anchoring even when long-term fundamentals point elsewhere.
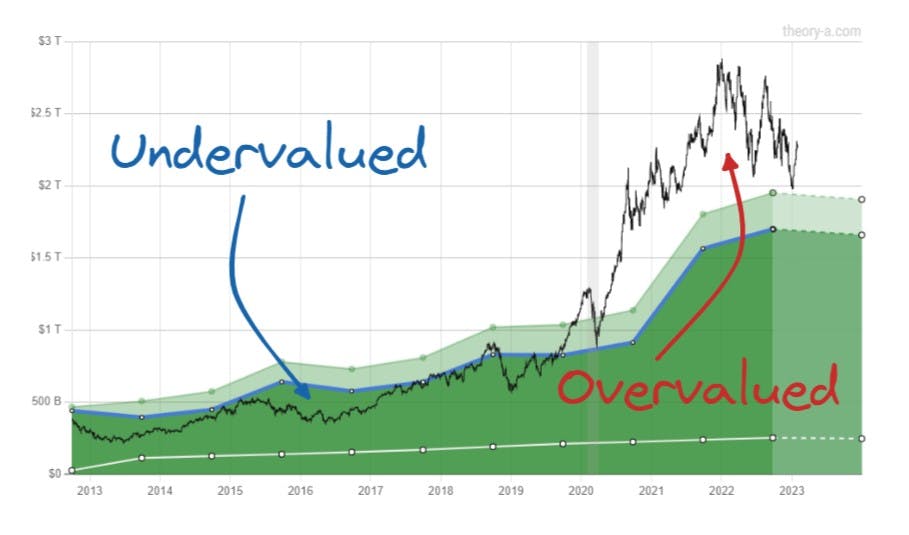
Theory A helps in identifying when the market's volatility map has become detached from valuation gravity, revealing opportunities for cheap convexity.
Hybrid Analysis
Overlay earnings, market cap, and the option chain matrix.
Intuitive P/E Dislocations
Contextualize the Price to Earnings ratio by comparing it against its history.
3D Options Chain
Visualize options data and profit/loss charts in an intuitive 3D format.

Decile Breakdown
Contextualize values relative to all other values.
Stock Screener
Portfolio
Open Positions
| Symbol | Description | Day | Shares | Price | Value | P&L Total | P&L % | Days Held |
|---|---|---|---|---|---|---|---|---|
| AAPL2 lotsAAPL | Added on AI momentum | — | 40 | $186.89avg→—now | $7,476basis→—now | — | — | |
| MSFTMSFT | Cloud + AI leader | — | 20 | $328.69avg→—now | $6,574basis→—now | — | — | |
| GOOGL2 lotsGOOGL | Added after Q3 earnings | — | 50 | $117.04avg→—now | $5,852basis→—now | — | — | |
| TSLATSLA | EV + energy storage bet | — | 35 | $202.04avg→—now | $7,071basis→—now | — | — |