
Profit Margins Visualized
Published: July 26, 2022
The basic function of a company is to use money to create more money. A useful measure of how efficiently a company does this is profit margin.
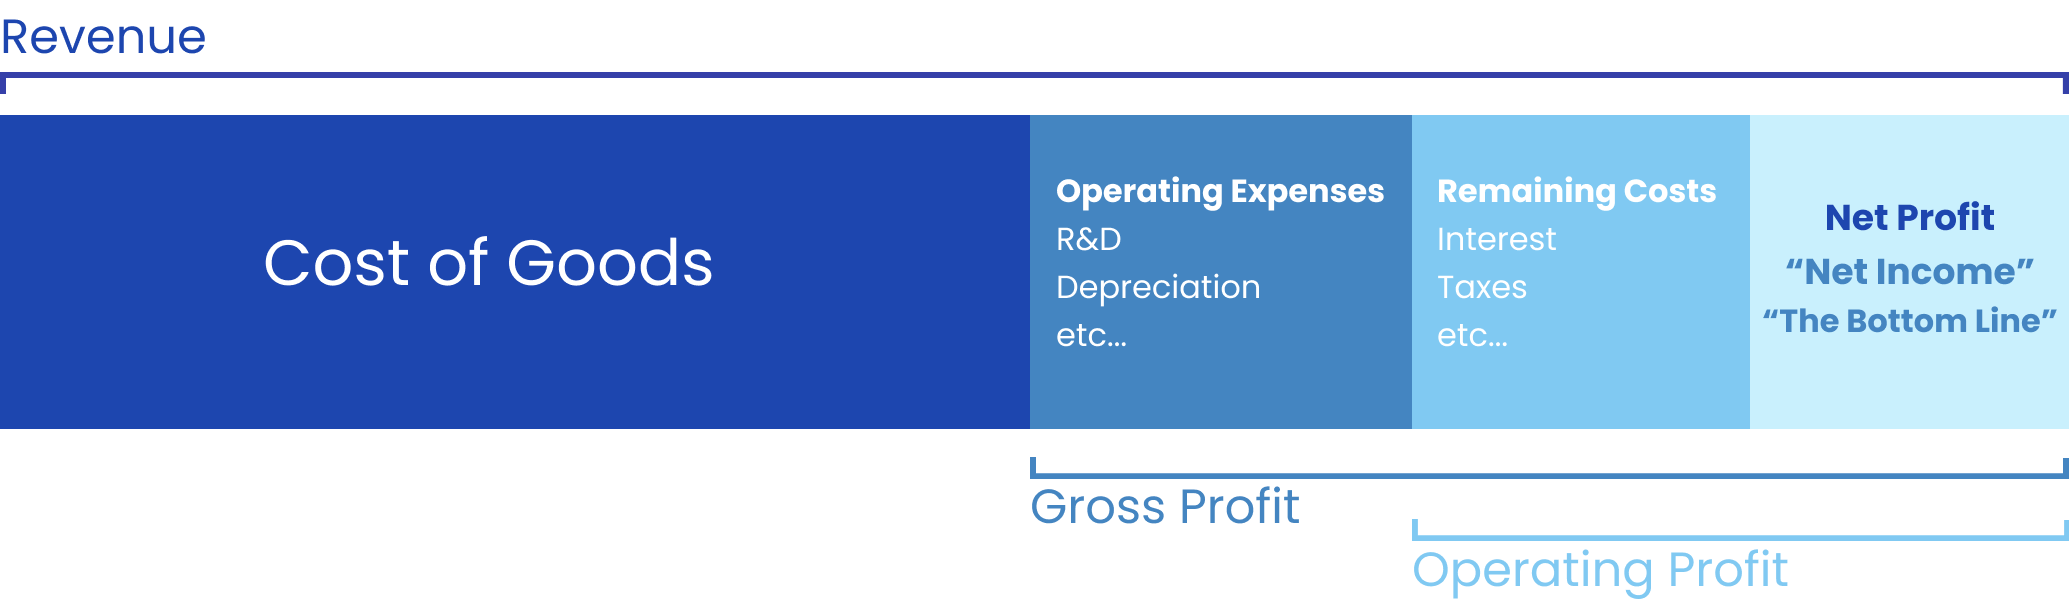
However there are various kinds of profit including Gross Profit, Operating Profit, and Net Profit. Here is a visualization of their differences.
What is Revenue?
Revenue also known as the "Top Line", is the total amount of money that is brought into the company.
What is Cost of Goods?
Cost of Goods is also known as Cost of Sales and is the cost of acquiring and creating the products that a company sells. It includes only the costs directly related production such as cost of labor and materials. It can be thought of as the "Book Value" of the goods a company sells. In order to make a profit, it must sell at higher than book value through value add such as marketing, support, distribution, etc...
What is Gross Profit?
Gross Profit or Gross Income is the total profit a company makes from selling its products and services.
What is Operating Profit?
Operating Profit is the money left over to the company as paying down all core functions necessary to keep the business running such as employee salaries.
What is Net Profit?
Net Profit or Net Income or Net Earnings takes the operating profit and pays down remaining expenses such as interest on loans and taxes. The remaining money is the net profit and can be returned to shareholders in the form of dividends, reinvested in the company, etc...